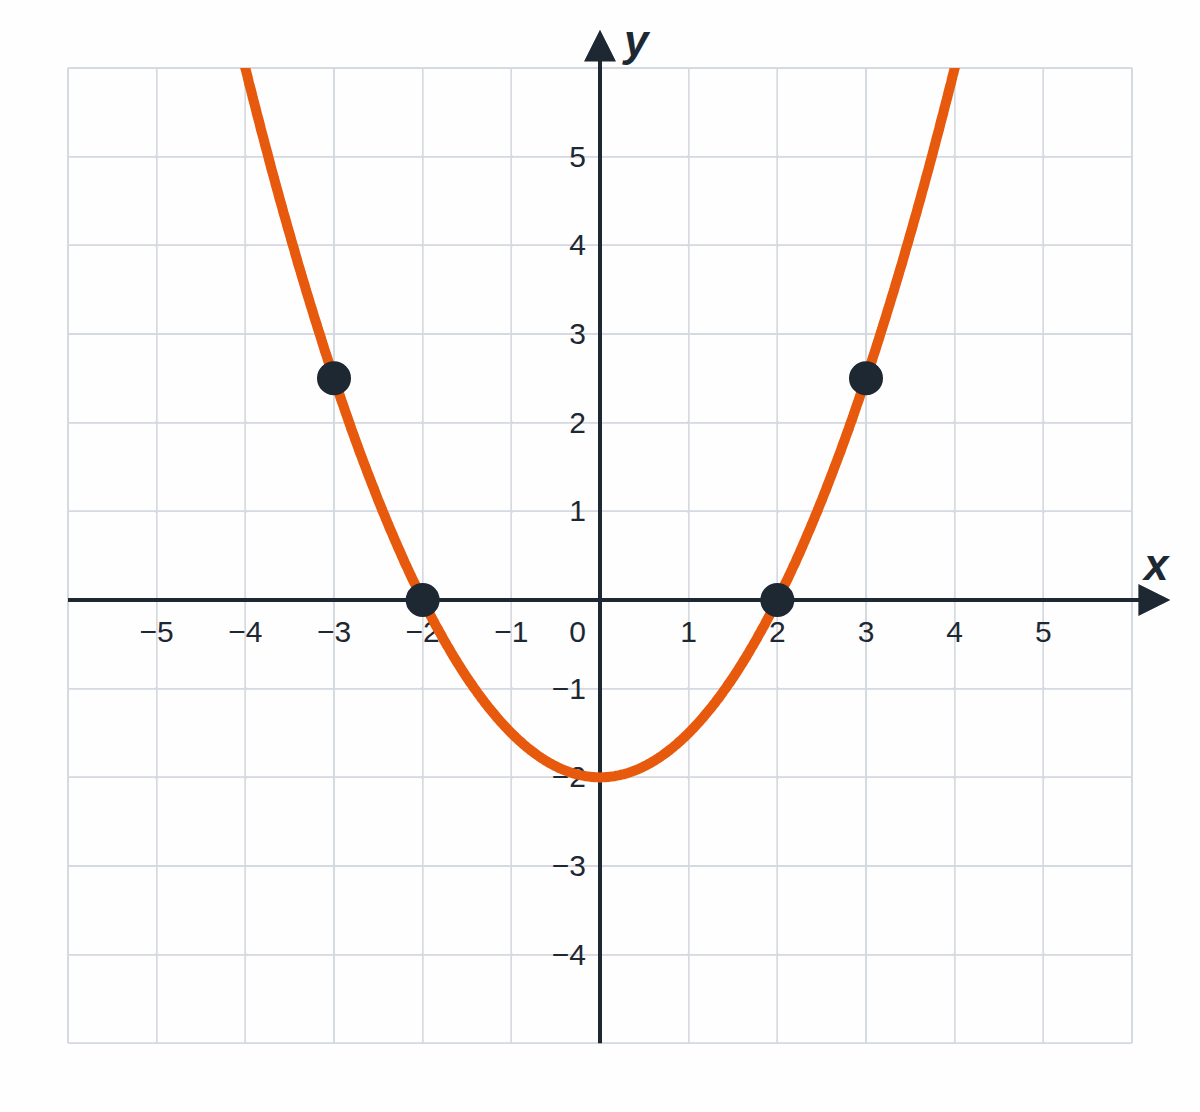
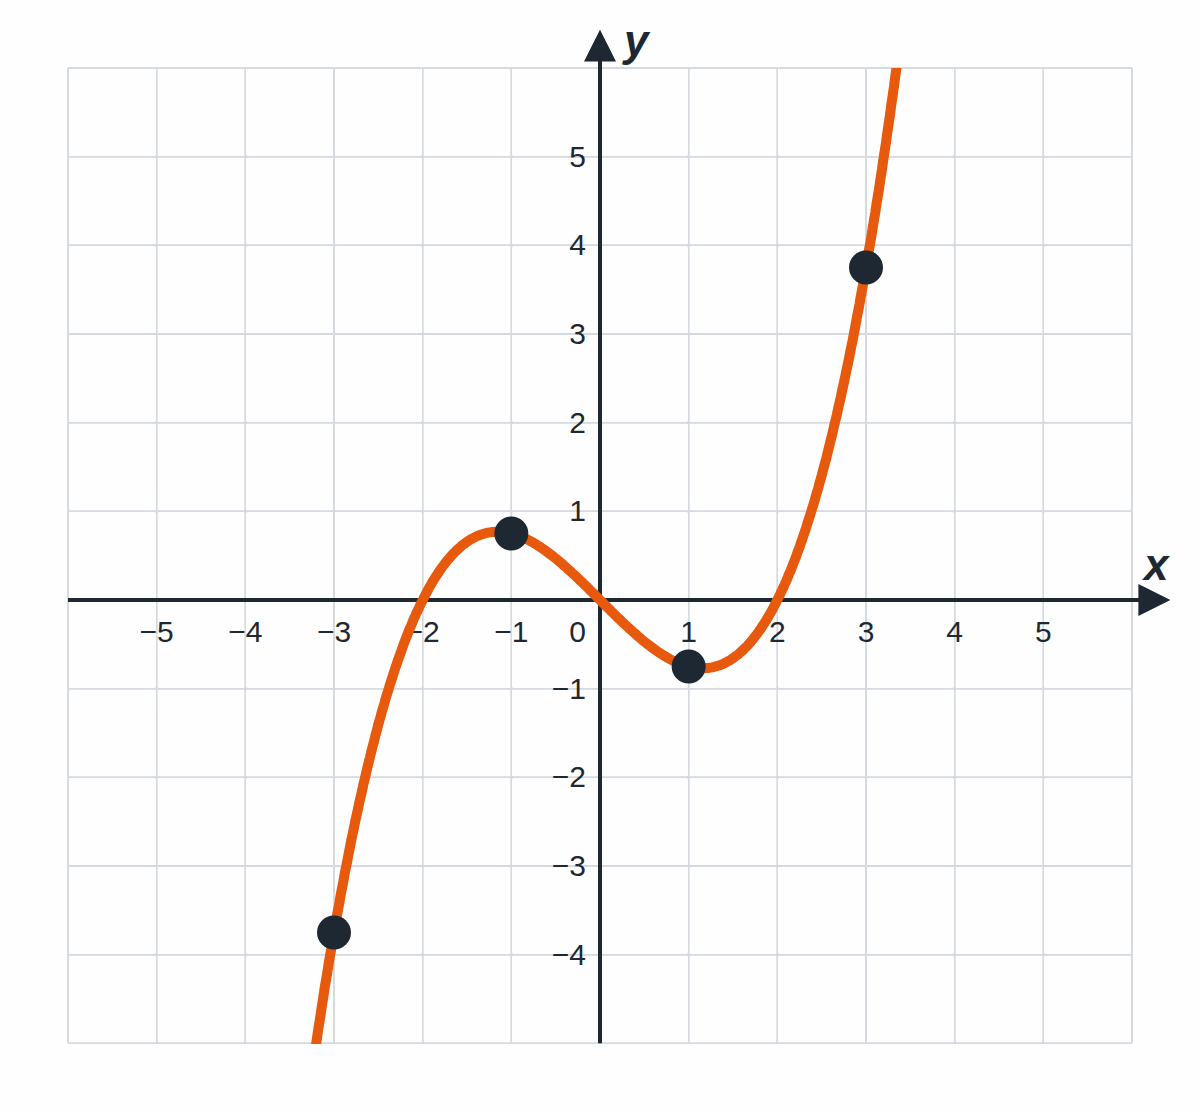
Fold a sheet of paper in half, drop some ink on it and unfold it again. You get a picture whose left half is the mirror image of the right half. Some graphs of functions look exactly like that — they are symmetric about the y-axis. We call such functions even. Other graphs land exactly on themselves when you turn them half a turn around the point (0, 0). Those are odd functions.
💡 The names are not random: x² and x⁴ have an even exponent and are even functions; x and x³ have an odd exponent and are odd functions.
How to check by calculation
The method has three steps:
Check that the domain is symmetric about zero (whenever it contains x, it also contains −x).
Substitute −x for x in the formula and simplify.
Compare the result with f(x) and with −f(x).
Worked example 1
f(x) = x⁴ − 3x².
The domain is ℝ, which is symmetric.
f(−x) = (−x)⁴ − 3(−x)² = x⁴ − 3x².
We got the original formula: f(−x) = f(x). The function is even.
Worked example 2
f(x) = x³ − 5x.
The domain is ℝ.
f(−x) = (−x)³ − 5(−x) = −x³ + 5x.
That is −(x³ − 5x) = −f(x). The function is odd.
Worked example 3
f(x) = x2+12x.
The denominator x² + 1 is never zero, so the domain is ℝ.
f(−x) = (−x)2+12(−x)=x2+1−2x.
That is −f(x). The function is odd.
Neither even nor odd
Most functions are neither even nor odd.
Worked example 4
f(x) = x² + x.
f(2) = 4 + 2 = 6,
f(−2) = 4 − 2 = 2.
The value 2 is not equal to 6 (so it is not even) and not equal to −6 (so it is not odd). One such example is enough to disprove it.
💡 Typical sign: the formula mixes even and odd powers (x² + x), or the graph is shifted sideways, for example |x − 2| or (x − 1)².
Watch the domain
The function f(x) = x² for x ∈ [−2, 3] is not even. The number 3 is in the domain, but −3 is not. There is nothing to compare with, so the equation f(−3) = f(3) cannot hold.
If the domain is not symmetric about zero, the function is neither even nor odd — whatever the formula is.
Common mistakes
(−x)² = −x². No! (−x)² = x², the minus disappears when you square. But (−x)³ = −x³.
Checking only one number. Being even must hold for all x. One example is only enough to show that a function is not even (or not odd).
Forgetting the constant. x³ + 2 is not odd: f(−x) = −x³ + 2, but −f(x) = −x³ − 2.
Ignoring the domain. A domain that is not symmetric means neither even nor odd.
Summary
Even: f(−x) = f(x), graph symmetric about the y-axis.
Odd: f(−x) = −f(x), graph symmetric about the point (0, 0).
First check that the domain is symmetric about zero.
Substitute −x, simplify, and compare with f(x) and −f(x).
Try it yourself
Decide whether each function is even, odd or neither:
f(x) = 2x⁶ − x²
f(x) = x⁵ + x
f(x) = x³ + 1
f(x) = |x| − 4
f(x) = x² for x ∈ [−3, 3]
Answers: 1. even, 2. odd, 3. neither, 4. even, 5. even (the domain is symmetric).