Article Contents
- The Coordinate System
- Points in the Plane
- Plotting Points from a Table
- Drawing a Graph
- Reading Values from a Graph
- Increasing and Decreasing
- Intercepts
- Examples of Common Graphs
- Common Mistakes
- Interactive Exercises
1. The Coordinate System {#coordinate-system}
A Cartesian coordinate system consists of two perpendicular number lines:
- x-axis (horizontal): shows the independent variable
- y-axis (vertical): shows the dependent variable
- Origin O=(0,0): where the axes cross
- Quadrants I, II, III, IV: the four regions created by the axes
2. Points in the Plane {#points-in-plane}
Every point is described by an ordered pair (x,y):
- x = horizontal position (left/right from origin)
- y = vertical position (up/down from origin)
Examples
| Point | x | y | Quadrant |
| A(2,2) | 2 | 2 | I |
| B(−2,1) | −2 | 1 | II |
| C(−1,−2) | −1 | −2 | III |
| D(3,−1) | 3 | −1 | IV |
3. Plotting Points from a Table {#plotting-points}
Given a function table, plot each pair (x,f(x)) as a point.
Example: f(x)=x2−2
| x | −3 | −2 | −1 | 0 | 1 | 2 | 3 |
| f(x) | 7 | 2 | −1 | −2 | −1 | 2 | 7 |
4. Drawing a Graph {#drawing-graph}
Step-by-step process
- Create a table of values (see Functions and Tables)
- Set up the coordinate system with appropriate scale
- Plot each point (x,f(x))
- Connect the points:
- With a straight line for linear functions
- With a smooth curve for other functions
- Label the graph with the function formula
Tips for choosing x-values
- For linear functions (f(x)=kx+q): 2 points are enough, but use 3 for safety
- For quadratic functions (f(x)=ax2+bx+c): use at least 5--7 points
- Always include x=0 if it is in the domain
- Choose values symmetrically around the interesting part
5. Reading Values from a Graph {#reading-from-graph}
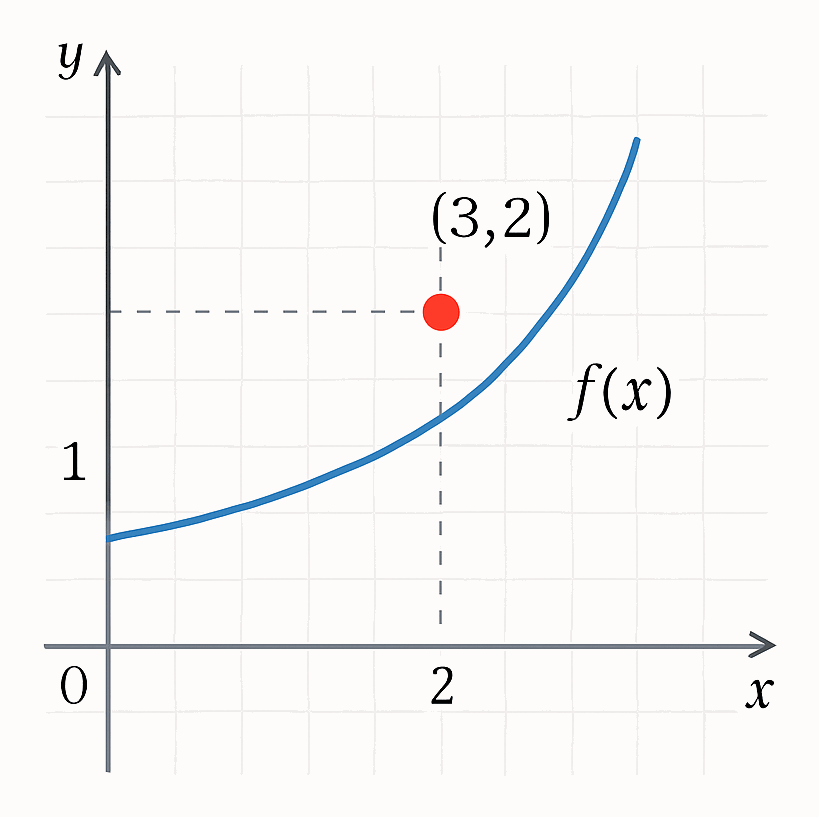
To find f(a) -- reading the output:
- Find x=a on the horizontal axis
- Go vertically to the graph
- Read the y-value at that point
- Find y=b on the vertical axis
- Go horizontally to the graph
- Read the x-value at that point
6. Increasing and Decreasing {#increasing-decreasing}
A graph shows us where a function is increasing or decreasing:
- Increasing: the graph goes up as you move right (when x grows, f(x) grows)
- Decreasing: the graph goes down as you move right (when x grows, f(x) shrinks)
7. Intercepts {#intercepts}
x-intercept (zero of the function)
The point where the graph crosses the x-axis, i.e., where f(x)=0.
y-intercept
The point where the graph crosses the y-axis, i.e., the value f(0).
Example: f(x)=2x−4
- y-intercept: f(0)=2(0)−4=−4, so the graph crosses the y-axis at (0,−4)
- x-intercept: 0=2x−4⟹x=2, so the graph crosses the x-axis at (2,0)
8. Examples of Common Graphs {#common-graphs}
9. Common Mistakes {#common-mistakes}
| Mistake | How to avoid it |
| Swapping x and y coordinates | Always write (x,y) -- horizontal first, vertical second |
| Connecting points with straight lines when the function is curved | Use a smooth curve for non-linear functions |
| Not enough points for a curved graph | Plot at least 5--7 points for quadratics and other curves |
| Forgetting to label axes and scale | Always mark the scale and axis names |
| Plotting (y,x) instead of (x,y) | The first number is always the horizontal position |
10. Interactive Exercises {#interactive-exercises}
Practice graphing skills:
Summary
| Concept | Description |
| Coordinate system | Two perpendicular axes (x horizontal, y vertical) with origin O |
| Point (x,y) | x = horizontal position, y = vertical position |
| Plotting | Create a table, plot points, connect them |
| Reading f(a) | Go from x=a vertically to the graph, read y |
| x-intercept | Where f(x)=0 (graph crosses x-axis) |
| y-intercept | The value f(0) (graph crosses y-axis) |
Related Articles