Article Contents
- What is a Function Table?
- Building a Table from a Formula
- Step-by-Step Example
- Reading Values from a Table
- Finding a Formula from a Table
- Tables with Real-Life Data
- From Table to Graph
- Common Mistakes
- Interactive Exercises
1. What is a Function Table? {#what-is-a-table}
A function table (or table of values) lists selected inputs and their corresponding outputs:
Each row contains an input-output pair (x,f(x)).
Tables are especially useful for:
- Computing specific values before drawing a graph
- Organising measured or experimental data
- Spotting patterns in a function's behaviour
Given a formula, follow these steps:
- Choose several x-values (include negative, zero, and positive values)
- Substitute each x into the formula
- Calculate f(x)
- Write the results in the table
Example: f(x)=x2+3
| x | Calculation | f(x) |
| −3 | (−3)2+3=9+3 | 12 |
| −2 | (−2)2+3=4+3 | 7 |
| −1 | (−1)2+3=1+3 | 4 |
| 0 | (0)2+3=0+3 | 3 |
| 1 | (1)2+3=1+3 | 4 |
| 2 | (2)2+3=4+3 | 7 |
| 3 | (3)2+3=9+3 | 12 |
3. Step-by-Step Example {#step-by-step}
Task: Complete the table for
f(x)=2x−4.
Step 1: Choose values:
x∈{−2,−1,0,1,2,3,4}
Step 2: Substitute and calculate:
f(−2)=2(−2)−4=−4−4=−8
f(−1)=2(−1)−4=−2−4=−6
f(0)=2(0)−4=0−4=−4
f(1)=2(1)−4=2−4=−2
f(2)=2(2)−4=4−4=0
f(3)=2(3)−4=6−4=2
f(4)=2(4)−4=8−4=4
Step 3: Write the table:
| x | −2 | −1 | 0 | 1 | 2 | 3 | 4 |
| f(x) | −8 | −6 | −4 | −2 | 0 | 2 | 4 |
Notice the pattern: each time x increases by 1, f(x) increases by 2. This is because the coefficient of x is 2.
4. Reading Values from a Table {#reading-from-table}
Given a table, you can answer questions like:
Q: What is f(3)?
Look at the column where x=3. The answer is f(3)=−1.
Q: For which x is f(x)=1?
Find the column where f(x)=1. The answer is x=2.
Q: For which x is f(x)=0?
The value f(x)=0 does not appear in the table. It falls between x=2 and x=3. We would need the formula or graph to find the exact value.
Sometimes you need to discover the rule behind a table.
Example
Step 1: Find the pattern in outputs:
4−1=3,
7−4=3,
10−7=3
The difference is constant (+3), so this is a linear function: f(x)=kx+q.
Step 2: The constant difference gives us the slope:
k=3.
Step 3: Use a known point, e.g.
f(0)=1:
1=3(0)+q⟹q=1
Result: f(x)=3x+1
Verification
f(4)=3(4)+1=13 -- matches the table.
6. Tables with Real-Life Data {#real-life-tables}
Temperature throughout the day
| Time | 6:00 | 9:00 | 12:00 | 15:00 | 18:00 | 21:00 |
| Temp (C) | 8 | 14 | 21 | 23 | 18 | 12 |
Here the independent variable is time and the dependent variable is temperature.
Taxi fare
| Distance (km) | 0 | 1 | 2 | 3 | 5 | 10 |
| Fare (\$) | 3 | 5 | 7 | 9 | 13 | 23 |
The fare increases by \2 per km, with a \3 base fee: f(d)=2d+3.
7. From Table to Graph {#table-to-graph}
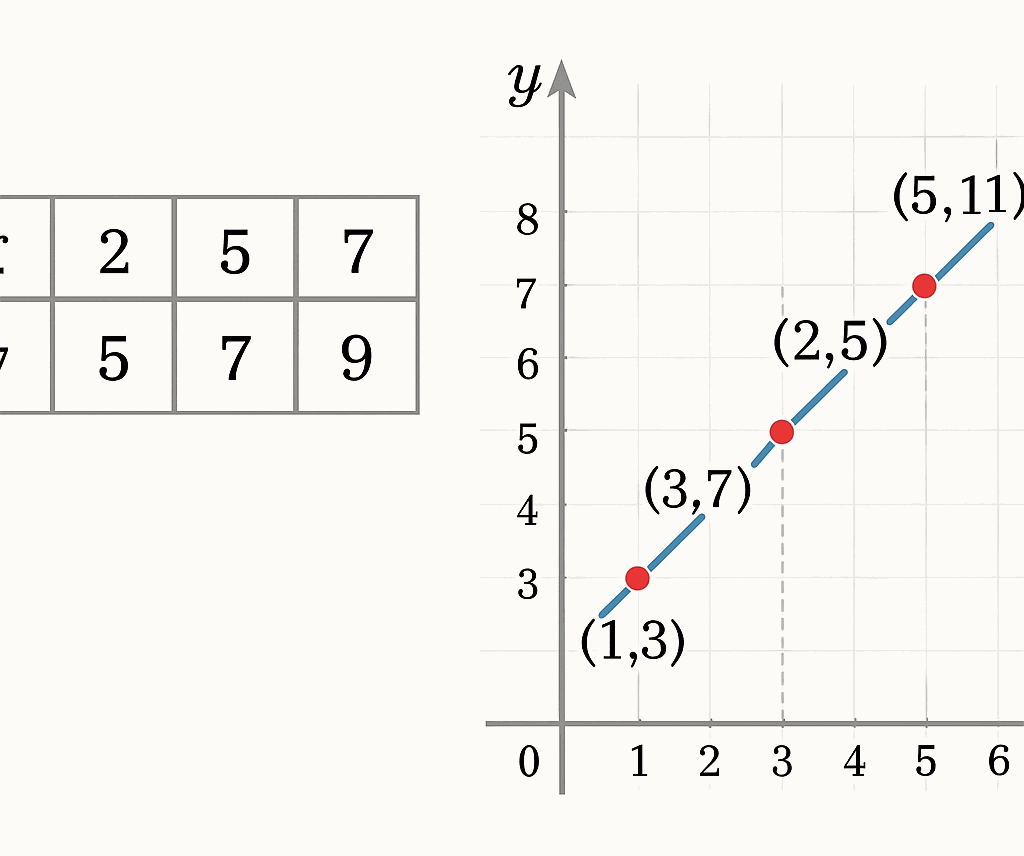
A table provides the points you need to draw a graph:
- Each pair (x,f(x)) becomes a point in the coordinate plane
- Plot all points
- Connect them with a smooth curve (or a straight line if linear)
See the detailed process in Functions and Graphs.
8. Common Mistakes {#common-mistakes}
| Mistake | How to avoid it |
| Forgetting negative signs when substituting | Use parentheses: f(−2)=(−2)2, not −22 |
| Choosing only positive x-values | Always include negative values and zero |
| Assuming a linear pattern without checking | Verify the difference is truly constant |
| Skipping the calculation column | Write out intermediate steps to reduce errors |
9. Interactive Exercises {#interactive-exercises}
Practice working with function tables:
Summary
| Concept | Description |
| Function table | Lists input-output pairs (x,f(x)) |
| Building a table | Choose x-values, substitute into the formula, compute f(x) |
| Reading a table | Find the column with the given x or f(x) |
| Finding a formula | Look for constant differences (linear) or other patterns |
Related Articles