The exponential function y = 2ˣ turns the number 3 into the number 8. What if we want to go the other way, from 8 back to 3? We need a function that answers "what power do you have to raise 2 to in order to get 8". That is the logarithm: log₂ 8 = 3.
The function y = logₐ x is called a logarithmic function. It is the inverse function of the exponential function y = aˣ: it does exactly the opposite job.
Contents
- The graph as a mirror image
- Properties of the logarithmic function
- Base greater than 1 and less than 1
- Shifted graphs
- The inverse of a shifted exponential
- Common mistakes
- Summary
- Try it yourself
- Practice
The graph as a mirror image
An inverse function swaps the input and the output. The point (3, 8) lies on the graph of y = 2ˣ, so the point (8, 3) lies on the graph of y = log₂ x. In the same way (0, 1) ↔ (1, 0) and (1, 2) ↔ (2, 1).
Swapping the coordinates is a reflection in the line y = x.
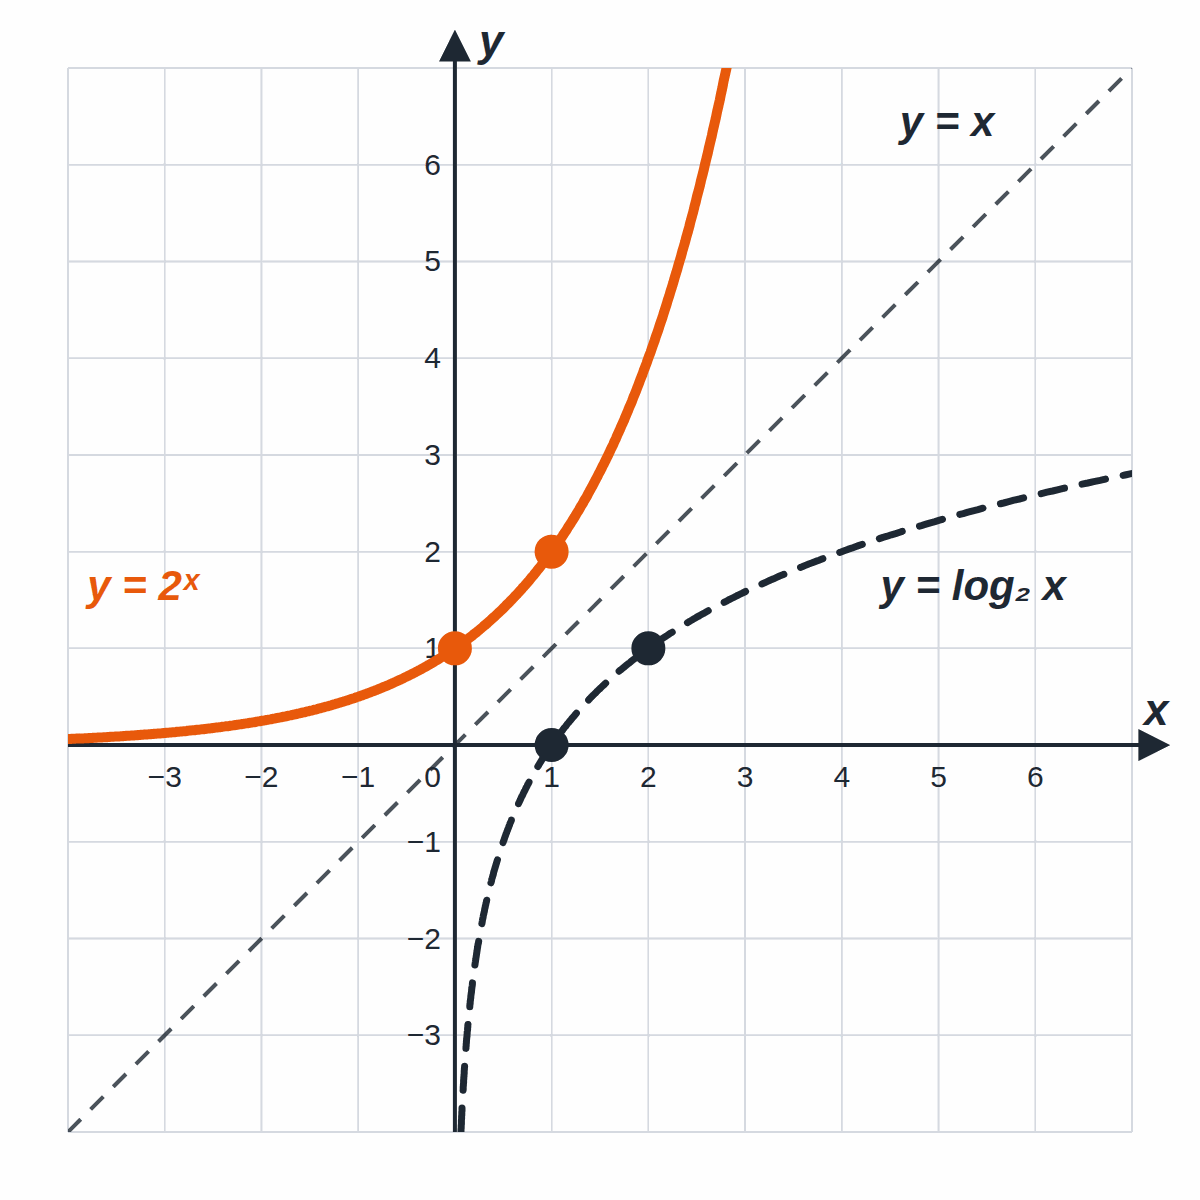
The graphs of y = aˣ and y = logₐ x are symmetric about the line y = x.
More about inverse functions in the article One-to-One and Inverse Functions.
Properties of the logarithmic function
When x and y swap, the domain and the range swap too:
| Property | y = aˣ | y = logₐ x |
|---|---|---|
| Domain | ℝ | (0, ∞), positive x only |
| Range | (0, ∞) | ℝ |
| Key point | (0, 1) | (1, 0) |
| Asymptote | the x-axis (y = 0) | the y-axis (x = 0) |
| Behaviour for a > 1 | increasing | increasing |
- The domain is the positive numbers only: neither log₂ 0 nor log₂ (−4) exists.
- The range is all real numbers. A logarithm can be negative too: log₂ ½ = −1.
- The graph always passes through the point (1, 0), because logₐ 1 = 0, and through the point (a, 1), because logₐ a = 1.
- The asymptote is the y-axis: as x gets closer to zero, the logarithm decreases (or increases) without limit.
Base greater than 1 and less than 1
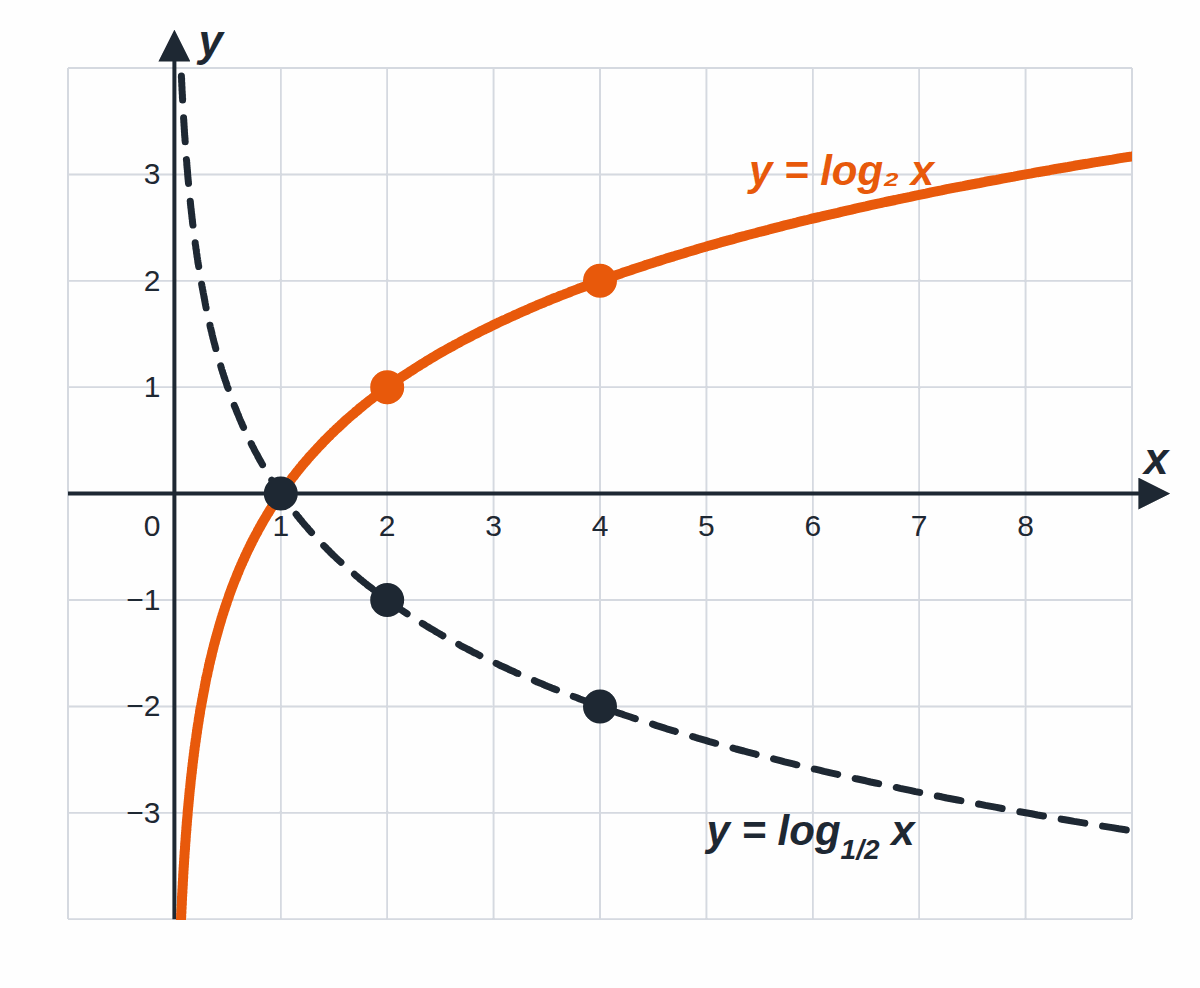
- For a > 1 the logarithmic function is increasing (for example log₂ x: 1 → 0, 2 → 1, 4 → 2, 8 → 3). It grows very slowly, though.
- For 0 < a < 1 it is decreasing (for example log base ½: 2 → −1, 4 → −2).
The graphs of log₂ x and log base ½ of x are symmetric about the x-axis.
Shifted graphs
Just as with other functions:
- y = logₐ (x − m) is the graph shifted m to the right, and the vertical asymptote is x = m,
- y = logₐ x + n is the graph shifted n up.
Worked example 1
y = log₂ (x − 1) + 2
- Asymptote: x = 1. Domain: x > 1.
- The point (1, 0) moves to (2, 2), where the argument is x − 1 = 1.
- The base is 2 > 1, so the function is increasing.