
In the article on absolute value functions a straight line turned into a V-shaped graph. Now we apply the same idea to a parabola. The absolute value can sit in two places, and each place changes the graph differently:
y = |x² − 4x + 3| — absolute value of the whole expression,
y = x² − 4|x| + 3 — absolute value only around x.
In every example we use the same parabola g(x) = x² − 4x + 3. Completing the square gives g(x) = (x − 2)² − 1: the vertex is (2, −1), the x-intercepts are (1, 0) and (3, 0), and the y-intercept is (0, 3).
Contents
- Absolute value of the whole expression
- Absolute value only around x
- Number of solutions of f(x) = c
- Telling four similar graphs apart
- Common mistakes
- Summary
- Try it yourself
- Practice
Absolute value of the whole expression
For y = |g(x)| we first work out the value of the parabola and only then make it positive. Positive values stay, negative values change sign.
| x | 0 | 1 | 2 | 3 | 4 |
|---|---|---|---|---|---|
| g(x) | 3 | 0 | −1 | 0 | 3 |
| |g(x)| | 3 | 0 | 1 | 0 | 3 |
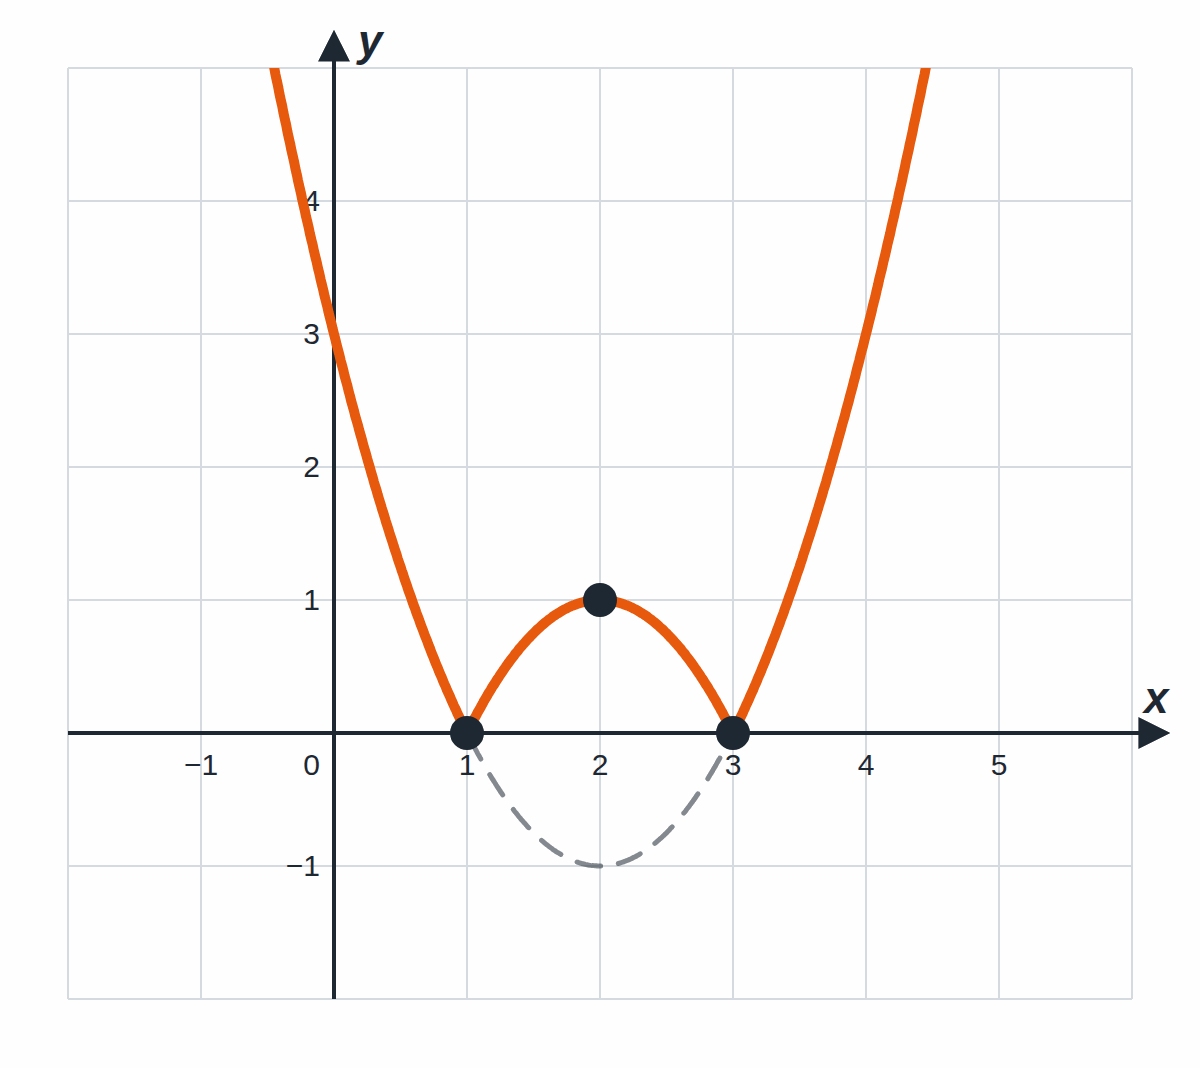
On the graph this means: the part of the parabola below the x-axis is reflected upwards (in the x-axis). Between the roots 1 and 3 a small "arch" appears with its highest point at (2, 1). The graph of y = |g(x)| never goes below the x-axis.
Absolute value only around x
For y = x² − 4|x| + 3 things are different. For x ≥ 0 we have |x| = x, so the expression is the same as g(x). For a negative x we get the same value as for the opposite positive number: x = −1 and x = 1 both give 1 − 4 + 3 = 0.
| x | −4 | −3 | −2 | −1 | 0 | 1 | 2 | 3 | 4 |
|---|---|---|---|---|---|---|---|---|---|
| y | 3 | 0 | −1 | 0 | 3 | 0 | −1 | 0 | 3 |
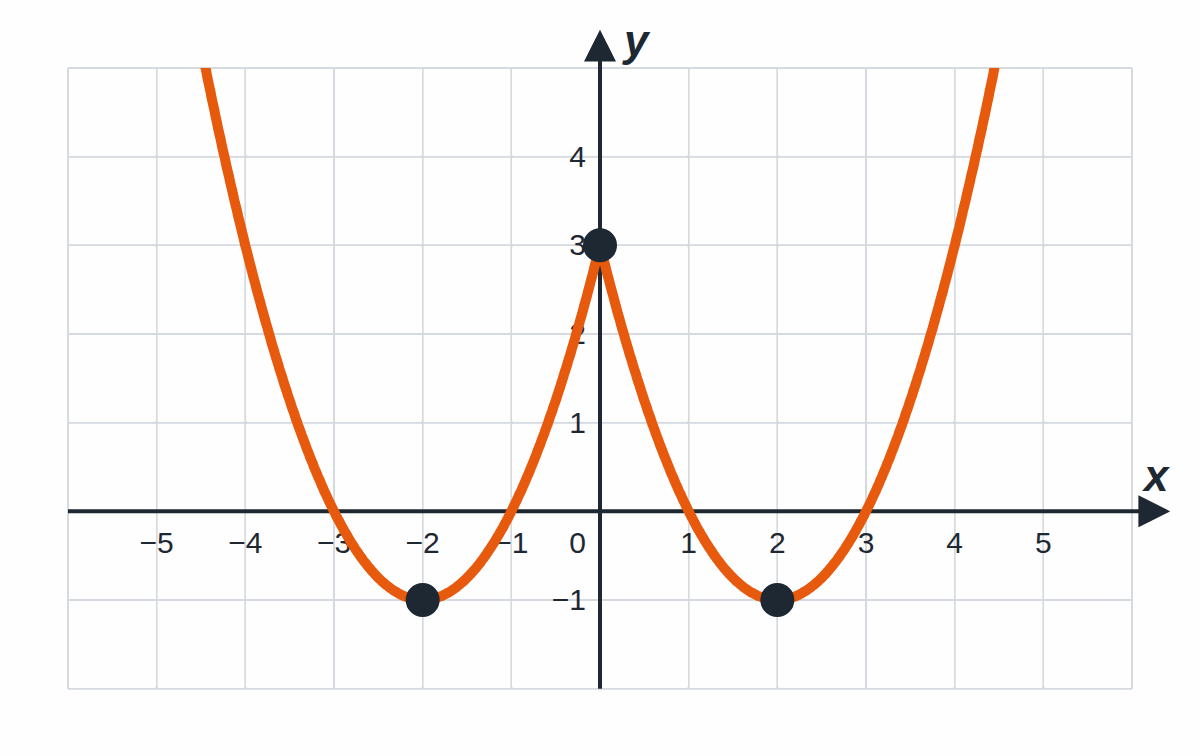
How to draw it: draw only the right half of the parabola (x ≥ 0) and mirror it in the y-axis. The left half of the original parabola is thrown away. The result is an even function — the graph is symmetric about the y-axis, with two minimum points (−2, −1) and (2, −1) and a peak at (0, 3).
💡 Careful: this graph can go below the x-axis. The absolute value is only around x, not around the whole result.
Number of solutions of f(x) = c
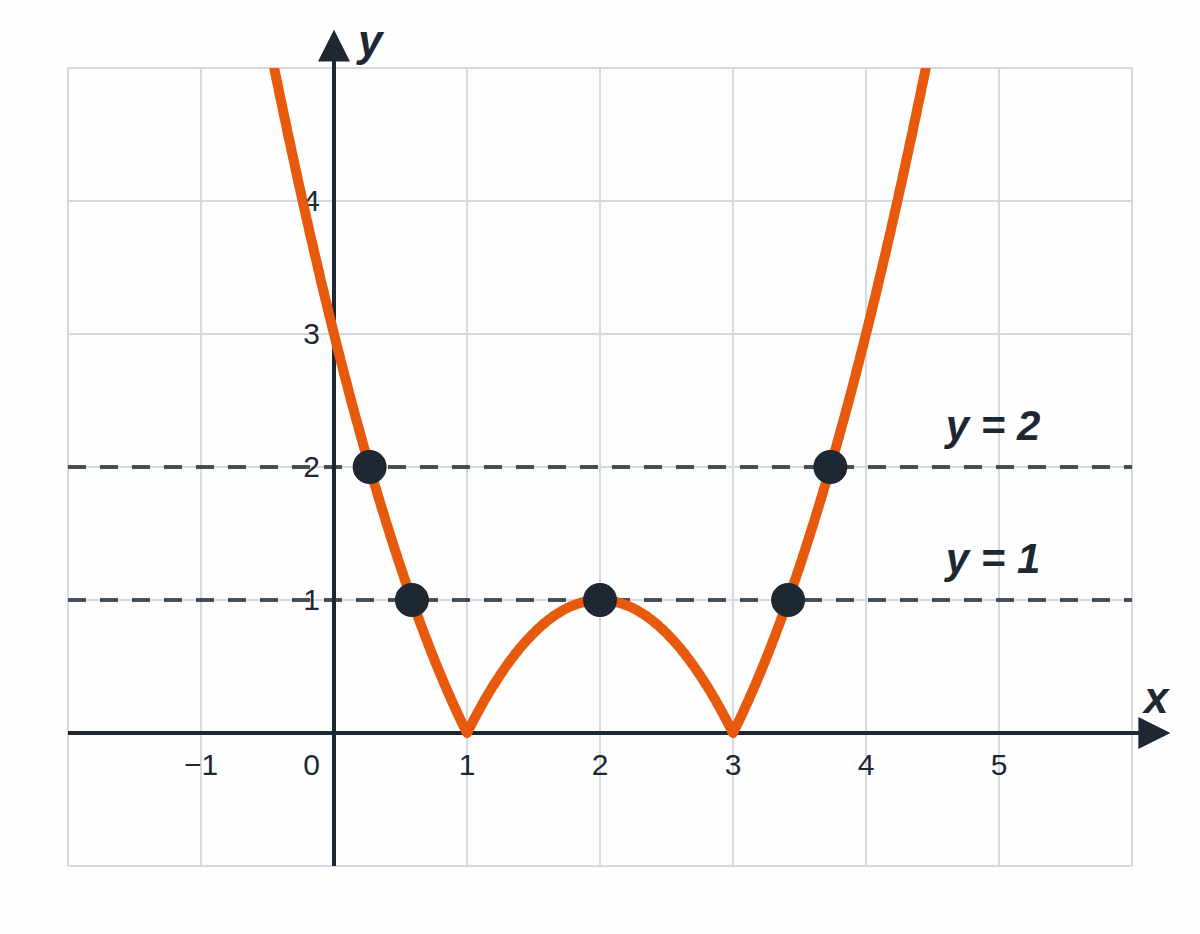
The solutions of f(x) = c are the x-coordinates of the points where the graph meets the horizontal line y = c. You only need to count them in the picture.
Worked example 1
How many solutions does |x² − 4x + 3| = c have for different values of c?
| c | number of solutions | why |
|---|---|---|
| c < 0 | 0 | the graph lies entirely on or above the x-axis |
| c = 0 | 2 | the points (1, 0) and (3, 0) |
| 0 < c < 1 | 4 | the line cuts both outer branches and the arch |
| c = 1 | 3 | the line touches the arch at (2, 1) |
| c > 1 | 2 | the line cuts only the outer branches |
For c = 1 we check by calculation: either x² − 4x + 3 = 1, so (x − 2)² = 2 and x = 2 ± √2, or x² − 4x + 3 = −1, so (x − 2)² = 0 and x = 2. Three solutions in total. ✓