Function Properties: Increasing, Bounded, Maximum, Minimum and One-to-One
Imagine that every day in summer you write down the temperature outside at 2 p.m. From the graph you can see straight away when it was getting warmer, when it was getting cooler, what the highest temperature was and whether it ever dropped below zero. We ask exactly these questions about every function. They are called the properties of a function, and you can read them from the graph without any calculation.
Throughout this article we read graphs from left to right, just like text in a book.
A function is increasing on an interval if its graph keeps going up from left to right there. A bigger x gives a bigger y.
A function is decreasing on an interval if its graph keeps going down from left to right. A bigger x gives a smaller y.
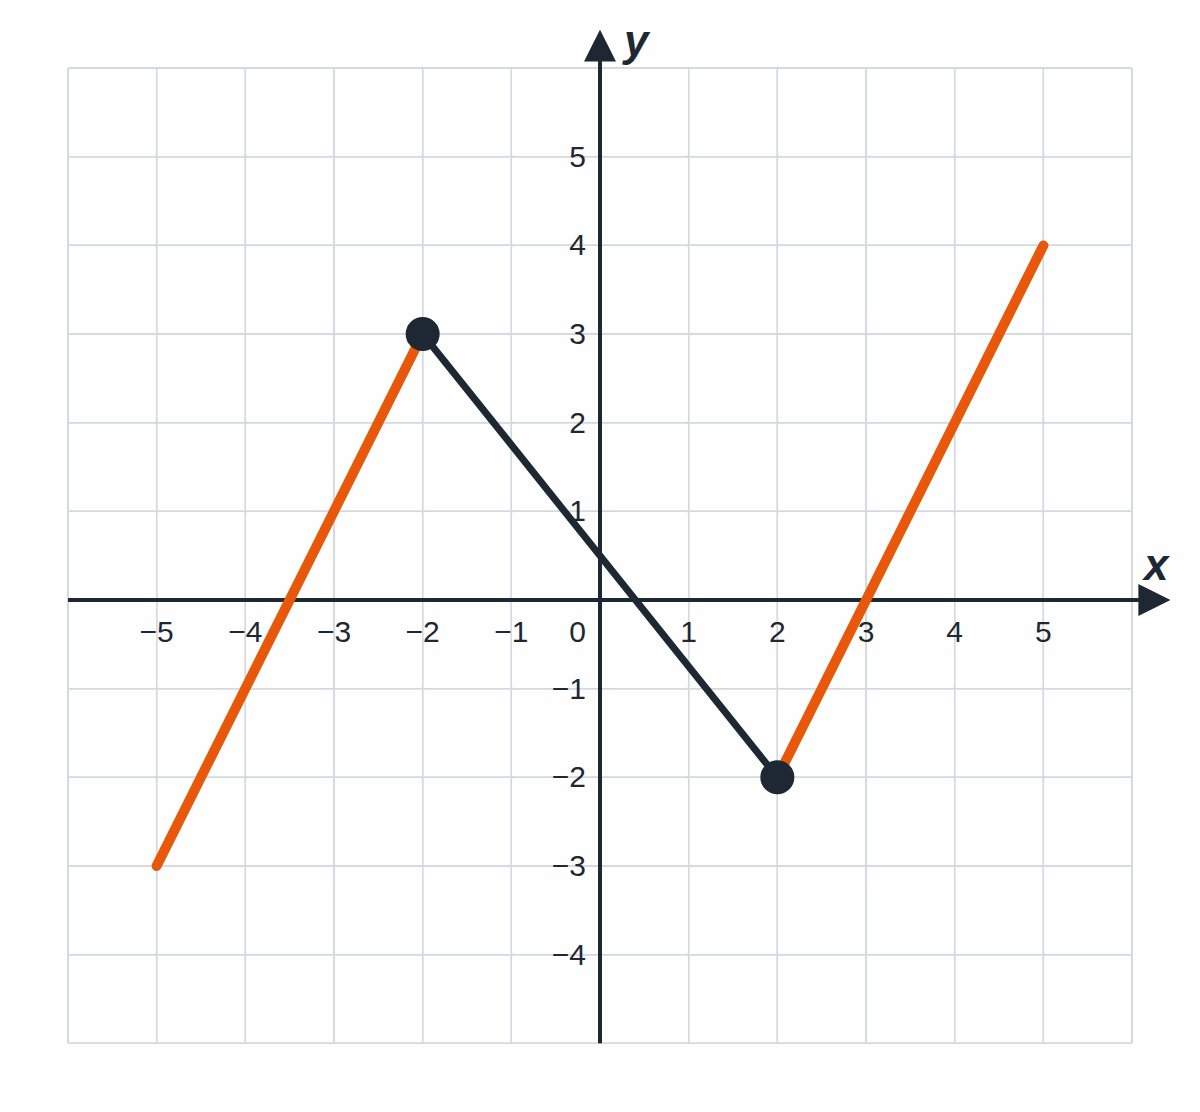
In the picture the function:
increases on the interval [−5, −2] (the orange part on the left),
decreases on the interval [−2, 2] (the black part),
increases again on the interval [2, 5].
We read [−2, 2] as "the closed interval from minus two to two". It contains all numbers from −2 to 2, including both endpoints.
In mathematical language: a function f is increasing on an interval I if for any two numbers x₁ < x₂ in I we have f(x₁) < f(x₂). In words: "when I move to the right, the value goes up".
If the graph on an interval is a horizontal line segment, the function is constant there — the value does not change. And if the graph first goes up and then goes down on an interval, the function is neither increasing nor decreasing there.
💡 Increasing and decreasing functions together are called monotonic functions.
Bounded functions
A function is bounded above if its graph never rises above some horizontal line. It is bounded below if its graph never falls below some horizontal line. If both are true, we simply say the function is bounded.
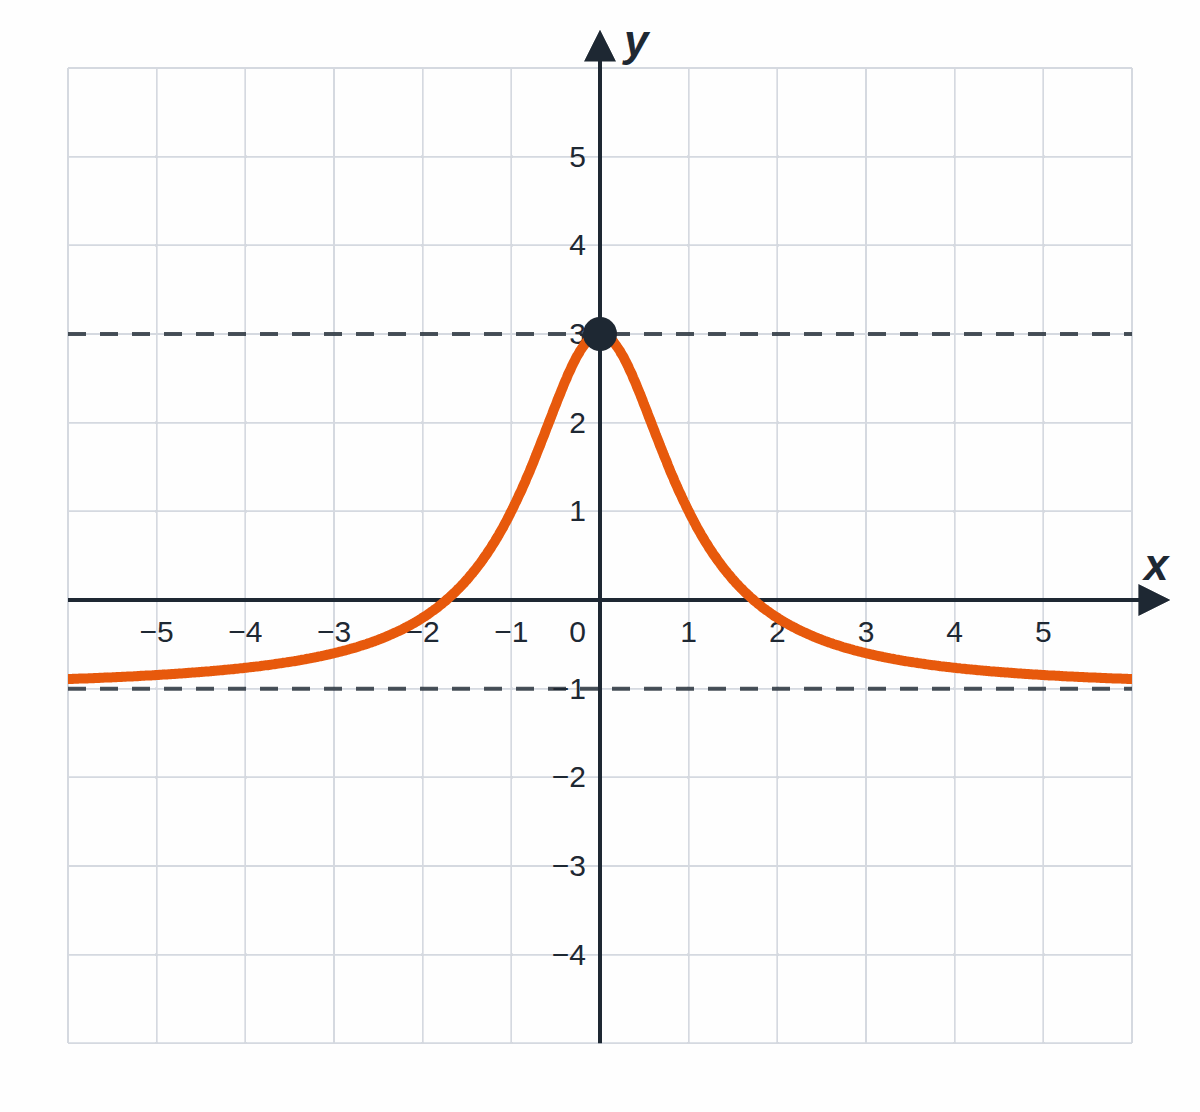
The graph in the picture stays in the strip between the lines y = −1 and y = 3. The function is bounded both above and below.
Be careful with graphs that have arrows at the ends: an arrow tells you the graph carries on in the same direction forever.
An arrow pointing up means the function is not bounded above.
An arrow pointing down means the function is not bounded below.
Horizontal arrows do not spoil boundedness.
Worked example 1
Is the function y = x² bounded?
A square is never negative, so x² ≥ 0. The graph never falls below the x-axis — the function is bounded below.
For x = 10 we get y = 100, for x = 1000 we get y = 1,000,000. The values grow without limit — the function is not bounded above.
Maximum and minimum
The maximum of a function is its greatest value — the y-coordinate of the highest point of the graph. The minimum is the smallest value — the y-coordinate of the lowest point.
In the picture above the highest point is (0, 3). The function has a maximum of 3 at x = 0.
This function has no minimum. The graph keeps getting closer to the line y = −1, but it never reaches it. Every value is a little bit bigger than −1, so none of them is the smallest.
⚠️ A function that is not bounded above cannot have a maximum. You can always find an even bigger value.
Worked example 2
The function y = −x² + 4. Does it have a maximum or a minimum?
−x² is always less than or equal to zero, so y ≤ 0 + 4 = 4.
The function reaches the value 4 at x = 0. The maximum is 4.
For large x the values get as small as you like (for x = 10, y = −96). The function has no minimum.
One-to-one functions
A function is one-to-one if it takes each value of y at most once. Two different numbers x never give the same value.
An everyday example: matching "student → number in the class register" is one-to-one, because each number belongs to only one student. Matching "student → month of birth" is not one-to-one, because several students were born in the same month.
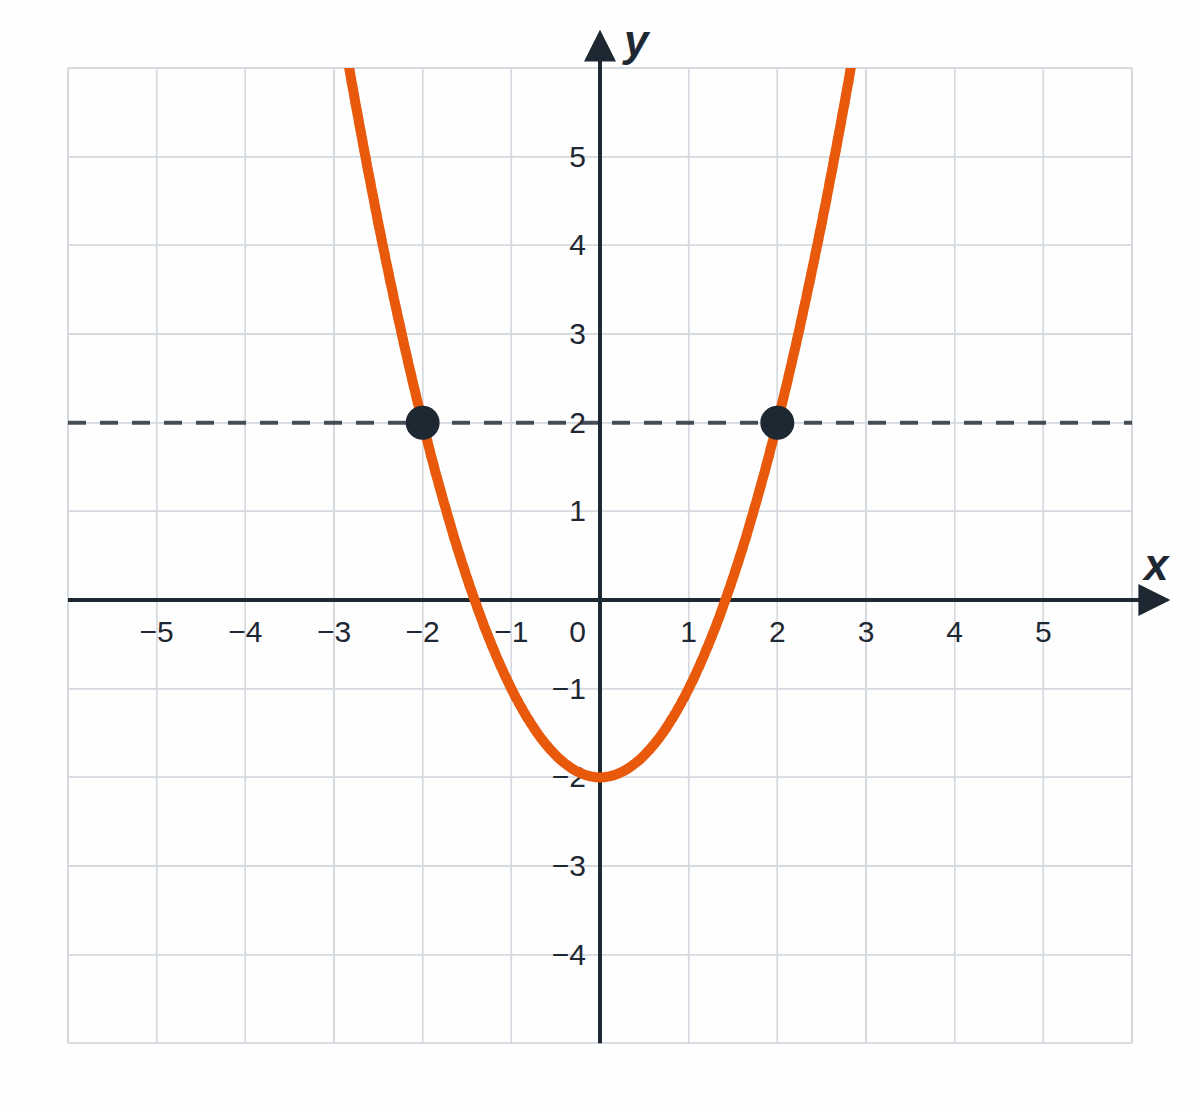
The function y = x² − 2 is not one-to-one: for x = −2 and for x = 2 we get y = 2.
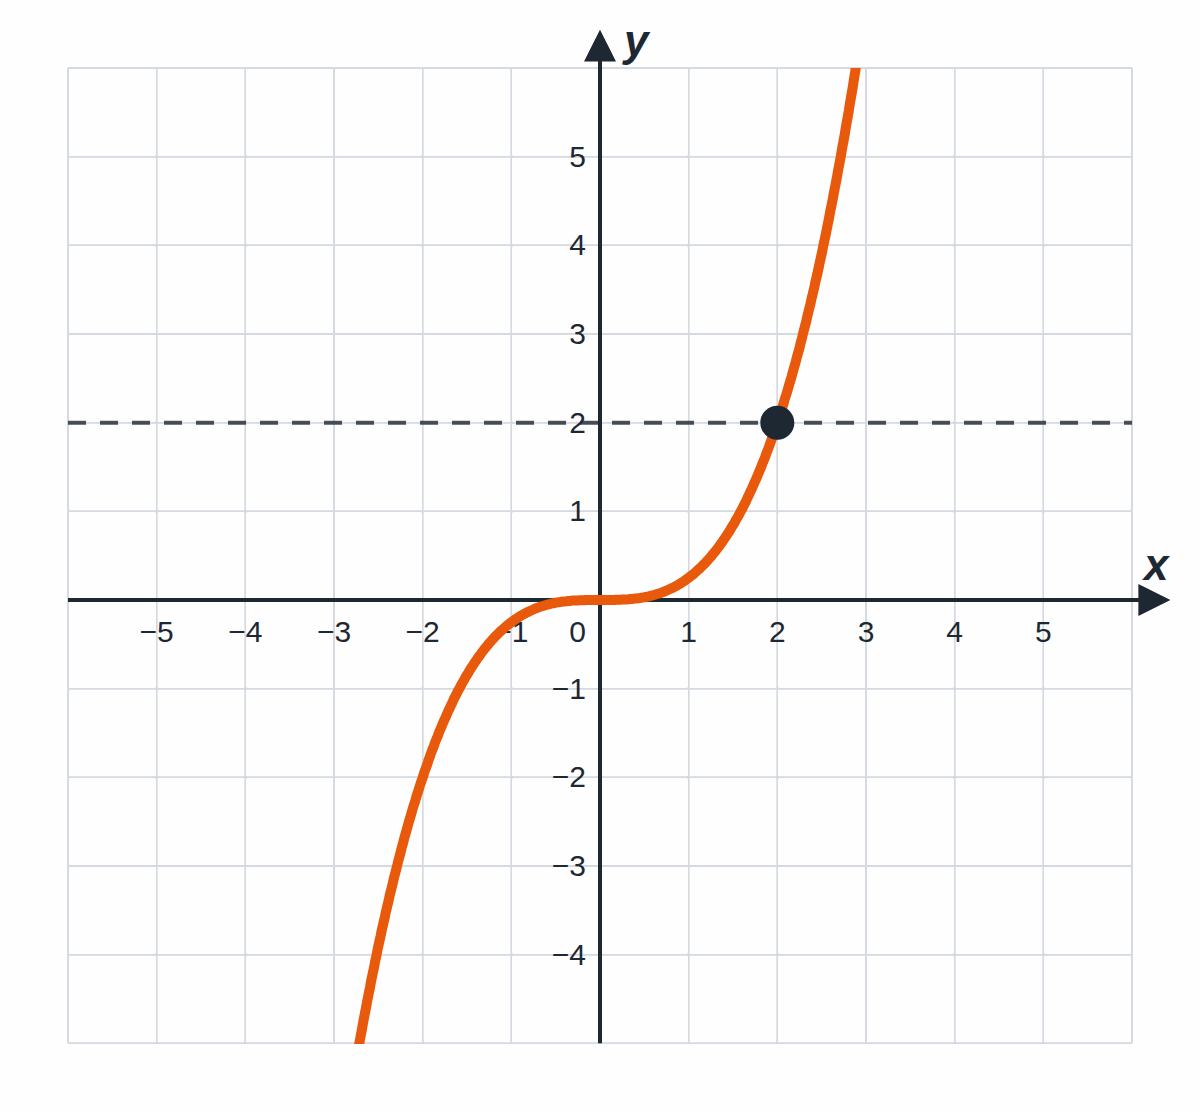
The function y = x³/4 is one-to-one. The graph keeps going up, so it reaches every height only once.
💡 Horizontal line test: If some horizontal line crosses the graph at least twice, the function is not one-to-one.
💡 Every function that is increasing on its whole domain (or decreasing on its whole domain) is one-to-one. One-to-one functions matter because only they have an inverse function.
Common mistakes
Reading the graph from right to left. "Increasing" always means going up from left to right.
Mixing up the maximum and where it occurs. The maximum is a y-value (for example 3), not the x at which the function reaches it.
Ignoring the arrows. An arrow pointing up means there is no maximum, even if the picture shows some "highest" point.
"It has a minimum because it gets close to −1." Getting close is not enough — the function must actually reach the value.
One-to-one = increasing. Every increasing function is one-to-one, but y = 1/x, for example, is one-to-one and not increasing.
Summary
Increasing: goes up from left to right. Decreasing: goes down from left to right.
Bounded above: the graph never rises above some line. Bounded below: it never falls below some line.
Maximum / minimum: the greatest / smallest y-value that the function actually reaches.
One-to-one: each y at most once. Use the horizontal line test.
Try it yourself
For the function y = |x| (a V-shaped graph with its vertex at (0, 0)) find:
On which interval is it decreasing and on which is it increasing?