Take a sheet of paper and fold it in half. You have 2 layers. Fold it again: 4 layers. Then 8, 16, 32. Every fold doubles the number of layers. After x folds you have 2ˣ layers.
This kind of "multiplying by the same number again and again" is described by an exponential function. The variable x is not in the base here but in the exponent, which is where the name comes from.
An exponential function has the formula y = aˣ, where the base a is a positive number other than 1. We read it as "y equals a to the x".
Contents
- Table of values and graph
- Why the base must be positive and not 1
- Properties of the exponential function
- Shifted graphs
- Common mistakes
- Summary
- Try it yourself
- Practice
Table of values and graph
Let's work out the values of y = 2ˣ for a few whole numbers x:
| x | −2 | −1 | 0 | 1 | 2 | 3 |
|---|---|---|---|---|---|---|
| y = 2ˣ | ¼ | ½ | 1 | 2 | 4 | 8 |
Notice two things:
- One step to the right (x bigger by 1) doubles the value.
- One step to the left halves the value. The value gets closer and closer to zero, but it never becomes zero: ½, ¼, ⅛, …
Remember: 2⁰ = 1, and a negative exponent means the reciprocal, for example 2⁻² = 1/2² = ¼.
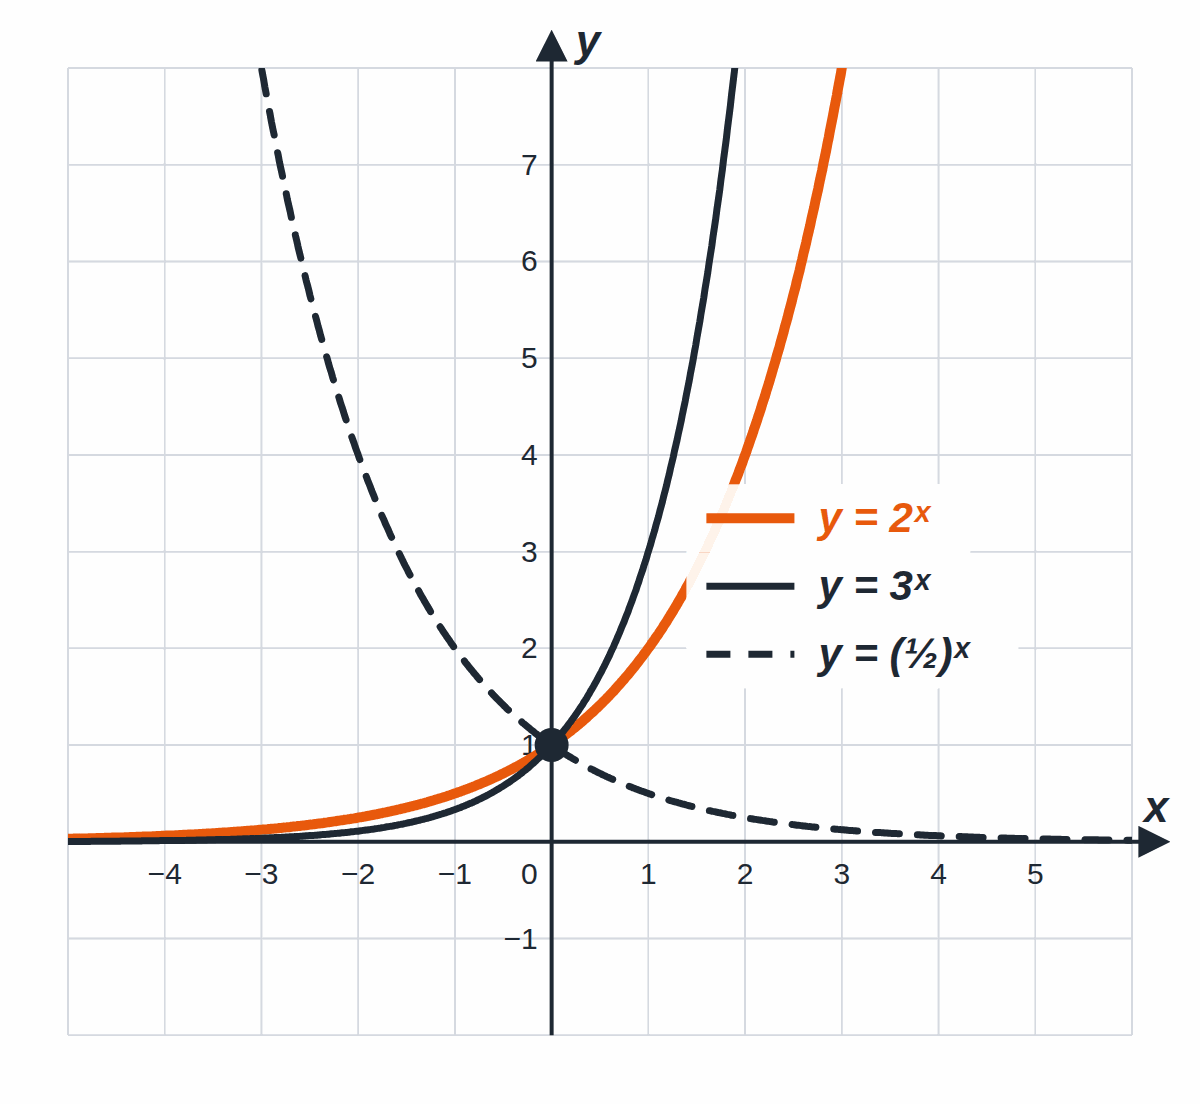
The picture shows three exponential functions. All of them pass through the point (0, 1), because any positive number to the power of zero is 1.
- y = 3ˣ grows faster than y = 2ˣ: a bigger base gives a steeper graph.
- y = (½)ˣ is the mirror image of y = 2ˣ in the y-axis. When the base is between 0 and 1, the function decreases.
Why the base must be positive and not 1
- Base 1: 1ˣ = 1 for every x. That is a constant function; there is nothing exponential about it.
- Negative base: (−2)^½ = √(−2) does not exist. The function would be undefined for many values of x.
- Base 0: 0⁻¹ = 1/0 makes no sense.
That is why we always require a > 0 and a ≠ 1 (read "a is greater than zero and not equal to one").
Properties of the exponential function
| Property | a > 1 (e.g. 2ˣ) | 0 < a < 1 (e.g. (½)ˣ) |
|---|---|---|
| Domain | all real numbers ℝ | all real numbers ℝ |
| Range | (0, ∞), positive numbers only | (0, ∞), positive numbers only |
| Behaviour | increasing | decreasing |
| Point on the graph | (0, 1) | (0, 1) |
| Asymptote | the x-axis, y = 0 (on the left) | the x-axis, y = 0 (on the right) |
An asymptote is a line that the graph gets closer and closer to but never touches. For y = 2ˣ it is the x-axis: the values ½, ¼, ⅛ … get ever closer to zero but stay positive.
💡 The function is one-to-one: it takes each value only once. Thanks to that it has an inverse function, the logarithm. More in the article Logarithmic Functions.
Shifted graphs
The formula y = a^(x − m) + n shifts the graph of y = aˣ:
- m to the right (to the left if m is negative),
- n up (down if n is negative).
The asymptote and the point (0, 1) move together with the graph.
Worked example
Sketch the graph of y = 2^(x − 2) + 1.
- The asymptote moves 1 up: y = 1.
- The point (0, 1) moves 2 to the right and 1 up: (2, 2). This is where the exponent is zero: x − 2 = 0.
- One unit further to the right the exponent is 1: y = 2¹ + 1 = 3, the point (3, 3).
- The base 2 is greater than 1, so the function is increasing.
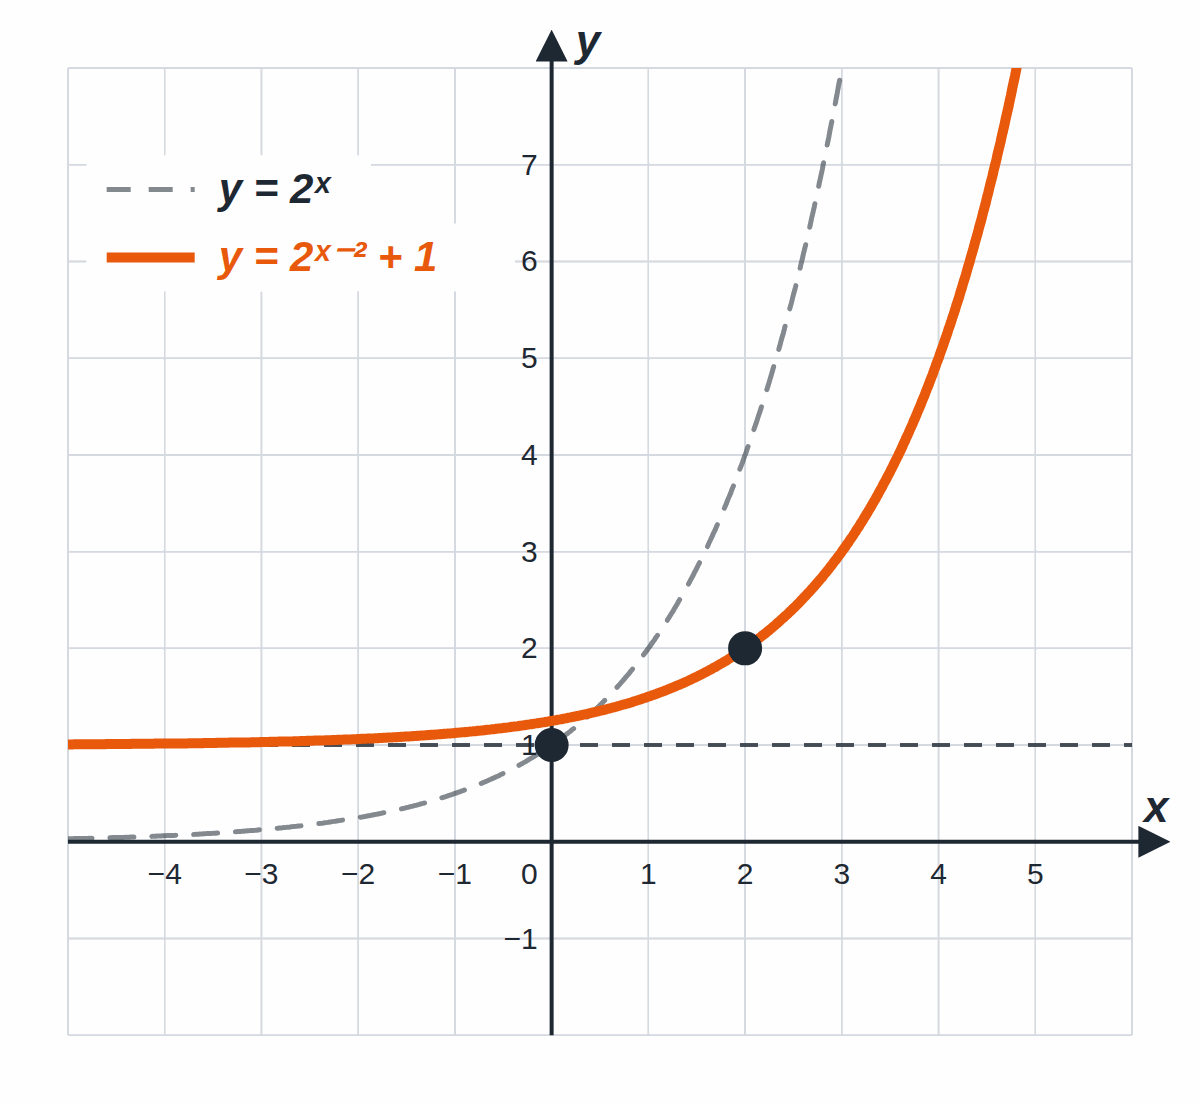
💡 How do you find the formula from a graph? Find the asymptote (that is n), then the point where the graph is 1 unit above the asymptote (its x-coordinate is m), and one unit further to the right read off how many times the graph has grown (that is a).